Minnesota’s growing decarbonization challenge is hidden beneath our feet
In a nutshell:
– Minnesota’s natural gas utilities are planning to grow their gas distribution systems and the volume of natural gas they deliver over the coming decades.
– Why it matters: Minnesota needs to rapidly reduce emissions from its buildings sector to meet state emission goals in a way that’s affordable, equitable, and provides family-sustaining jobs for Minnesotans.
– To do that, we first need to understand how our gas system works, how utilities invest in it, and how that affects Minnesotans.
Download a PDF version of this blog post.
As Fresh Energy works to drive reductions in carbon pollution across all sectors of our economy, the Buildings Department is kicking off a new effort: Characterizing Minnesota’s vast underground natural gas infrastructure, how it affects our communities, and how its growth as currently envisioned by some utilities is at odds with Minnesota’s climate goals. Rethinking our natural gas system is a necessary step toward decarbonizing our buildings and reaching our state’s climate action goals, as well as investing in our health, our communities, and family-sustaining clean energy jobs of the future.
Now is the time to focus on this important work: while greenhouse gas (GHG) emissions have been decreasing in Minnesota’s transportation, agricultural, and electric generation sectors compared to 2005, residential GHG emissions have actually increased by 14% due to the continued use of natural gas and other fossil fuels in buildings, according to the Minnesota Pollution Control Agency (MPCA), while emissions from the commercial sector have stayed fairly consistent with slight variability from variable heating seasons. And, according to projections from gas utility filings, utilities expect to increase the size of their system and the amount of gas that flows through it over the coming decades. As a result, even with the continued GHG reductions in other sectors, we won’t be able to meet our statewide GHG emissions reduction goals without reversing the trajectory of building sector GHG emissions.
The question, then, is how to reduce building sector GHG emissions—and importantly—how to do it in a way that centers affordability, equity, and family-sustaining jobs for Minnesotans. To answer these questions, we first need to take stock of the gas system itself. We need to understand how it works, how utilities invest in it, and how these investments affect Minnesotans.
Over the next several months, we’ll be unpacking many aspects of our natural gas system, including this blog post about its physical infrastructure. In future blogs, we will discuss potential policy solutions, possible future roles for gas utilities in Minnesota, and more. Stay tuned!
The hidden natural gas system beneath our feet
Natural gas is pretty simple: it’s a fossil fuel (primarily methane, or CH4) that is extracted from underground, piped across the country, and ultimately transferred into the gas utility distribution network. From there, gas utilities deliver gas to buildings through a network of pipes leading to the gas meter you may have on the side of your house. Inside your house or apartment, gas travels through an even smaller pipe network running from the meter to our furnaces, boilers, stoves, and water heaters where it is burned for heat.
Minnesota imports 100% of our natural gas from entities outside the state. We rely on the far-flung gas fields of Texas, Canada, the Dakotas, and other regions to heat our homes, cook our food, and heat our water. These gas molecules can travel thousands of miles to their destination. The questions we now face can be boiled down to: Is it worth the trip—and at what cost?
The first step in answering this question is to take a deeper dive into gas utilities’ distribution system.
Minnesota’s gas utilities have invested in a vast, underground natural gas distribution system of pipes, valves, and meters built along and beneath our roads, neighborhoods, and homes. There are two general kinds of distribution pipe infrastructure that are used to transport natural gas within the utility’s distribution system.
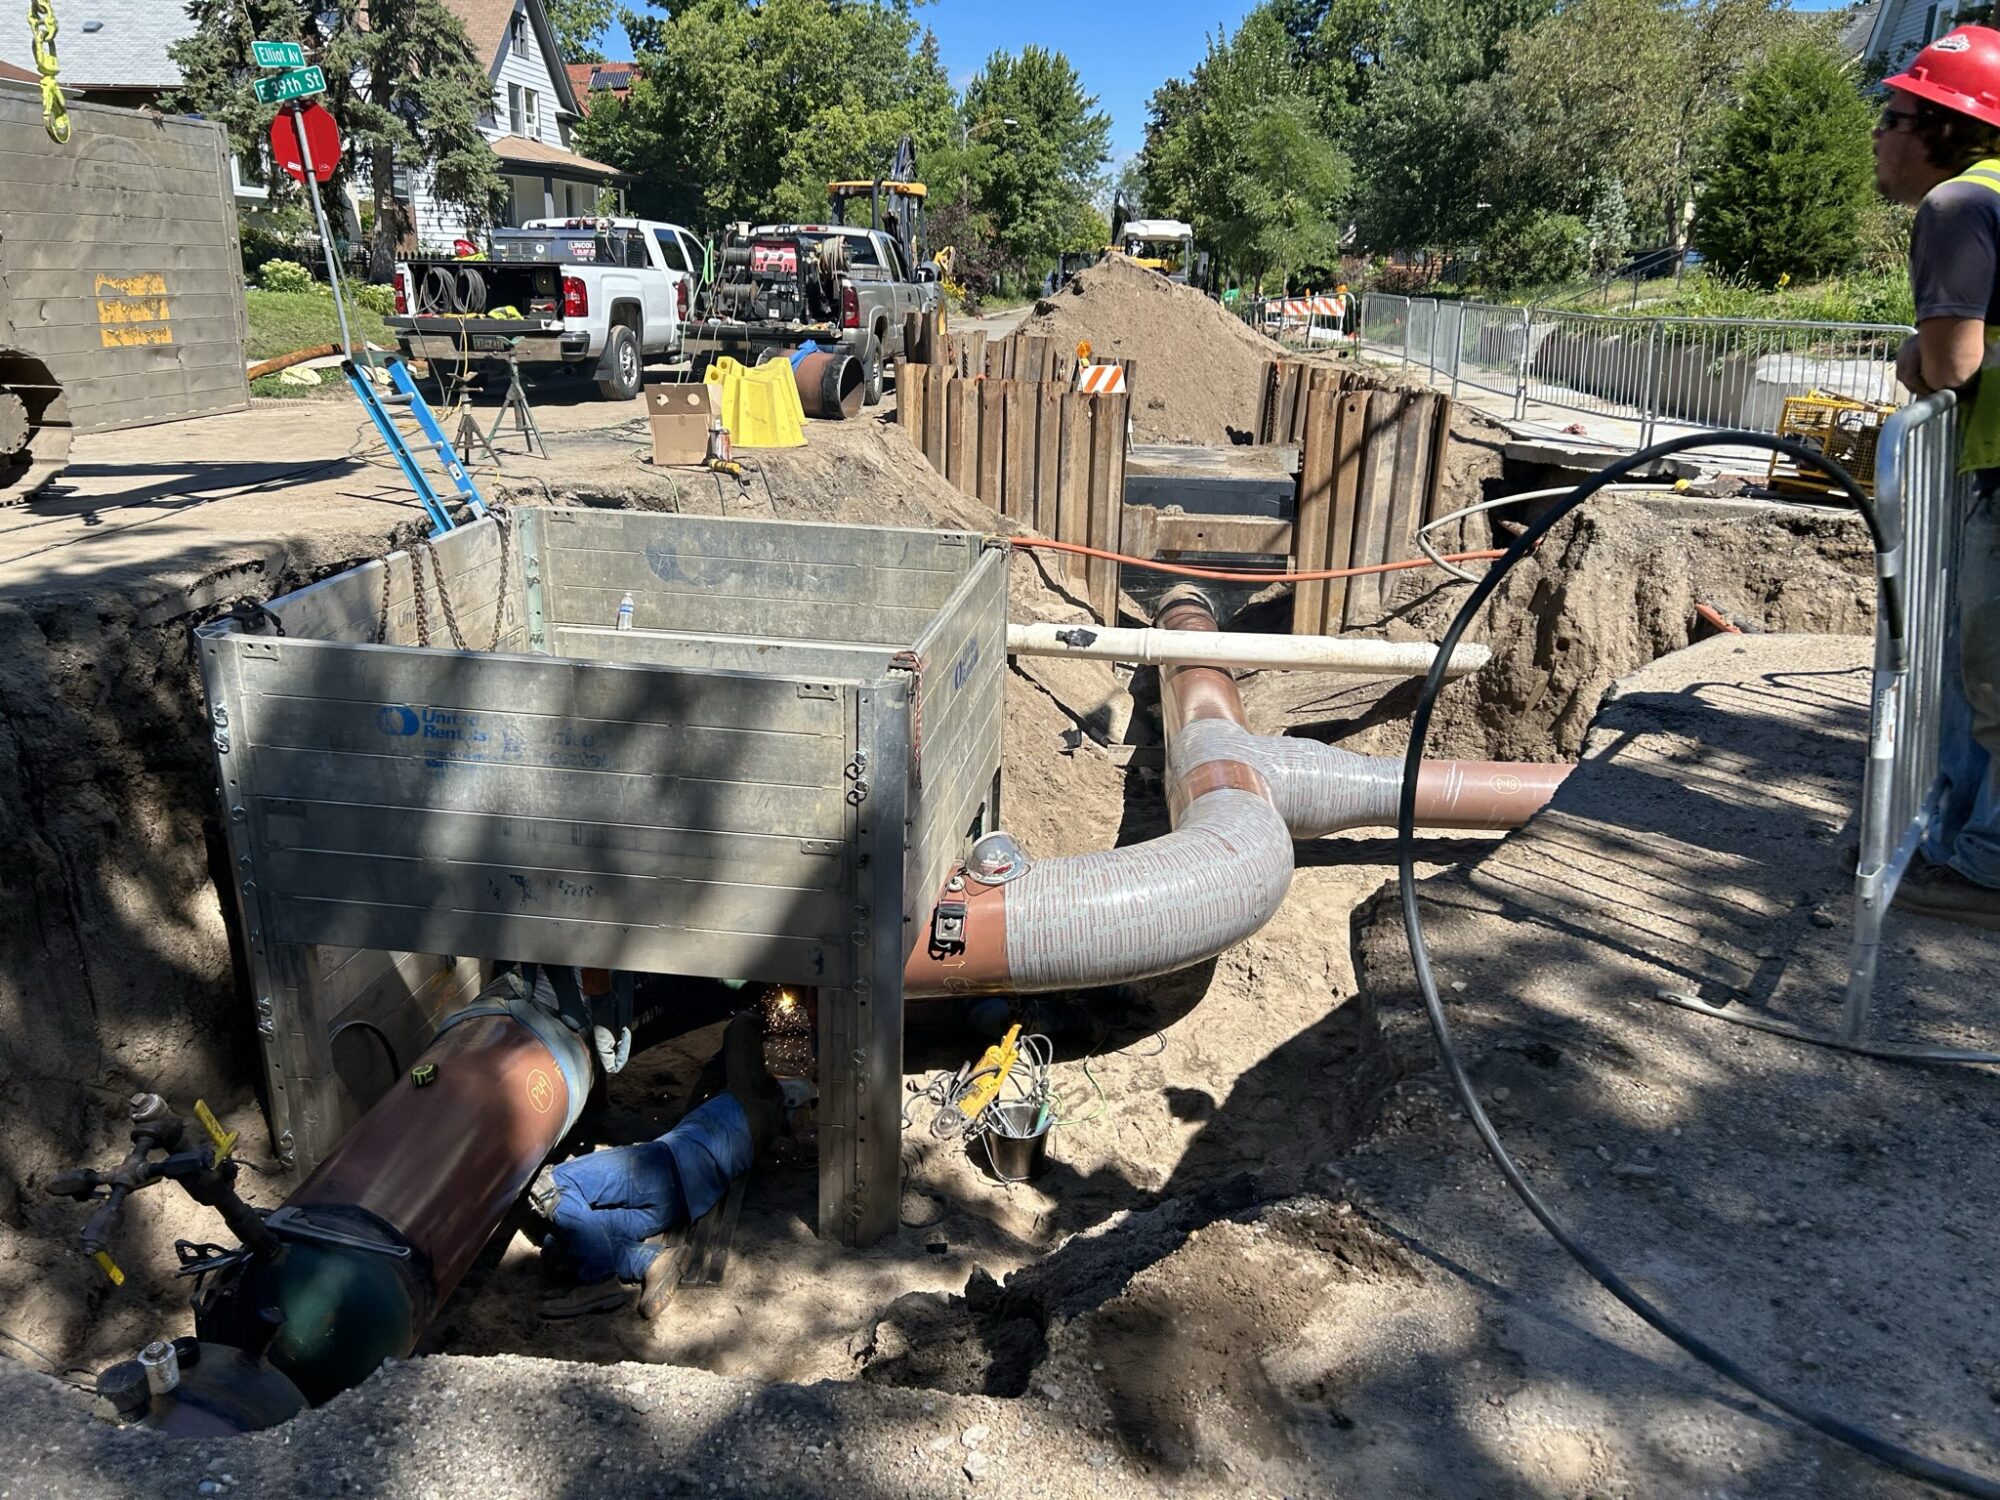
Gas mains are the larger, underground pipes that act like a highway for natural gas, delivering large amounts of it underground through neighborhoods and between communities. If you’ve ever had to detour around gas utility workers digging massive holes in our roads to work on large pipes beneath the street, you’ve likely seen a gas main!
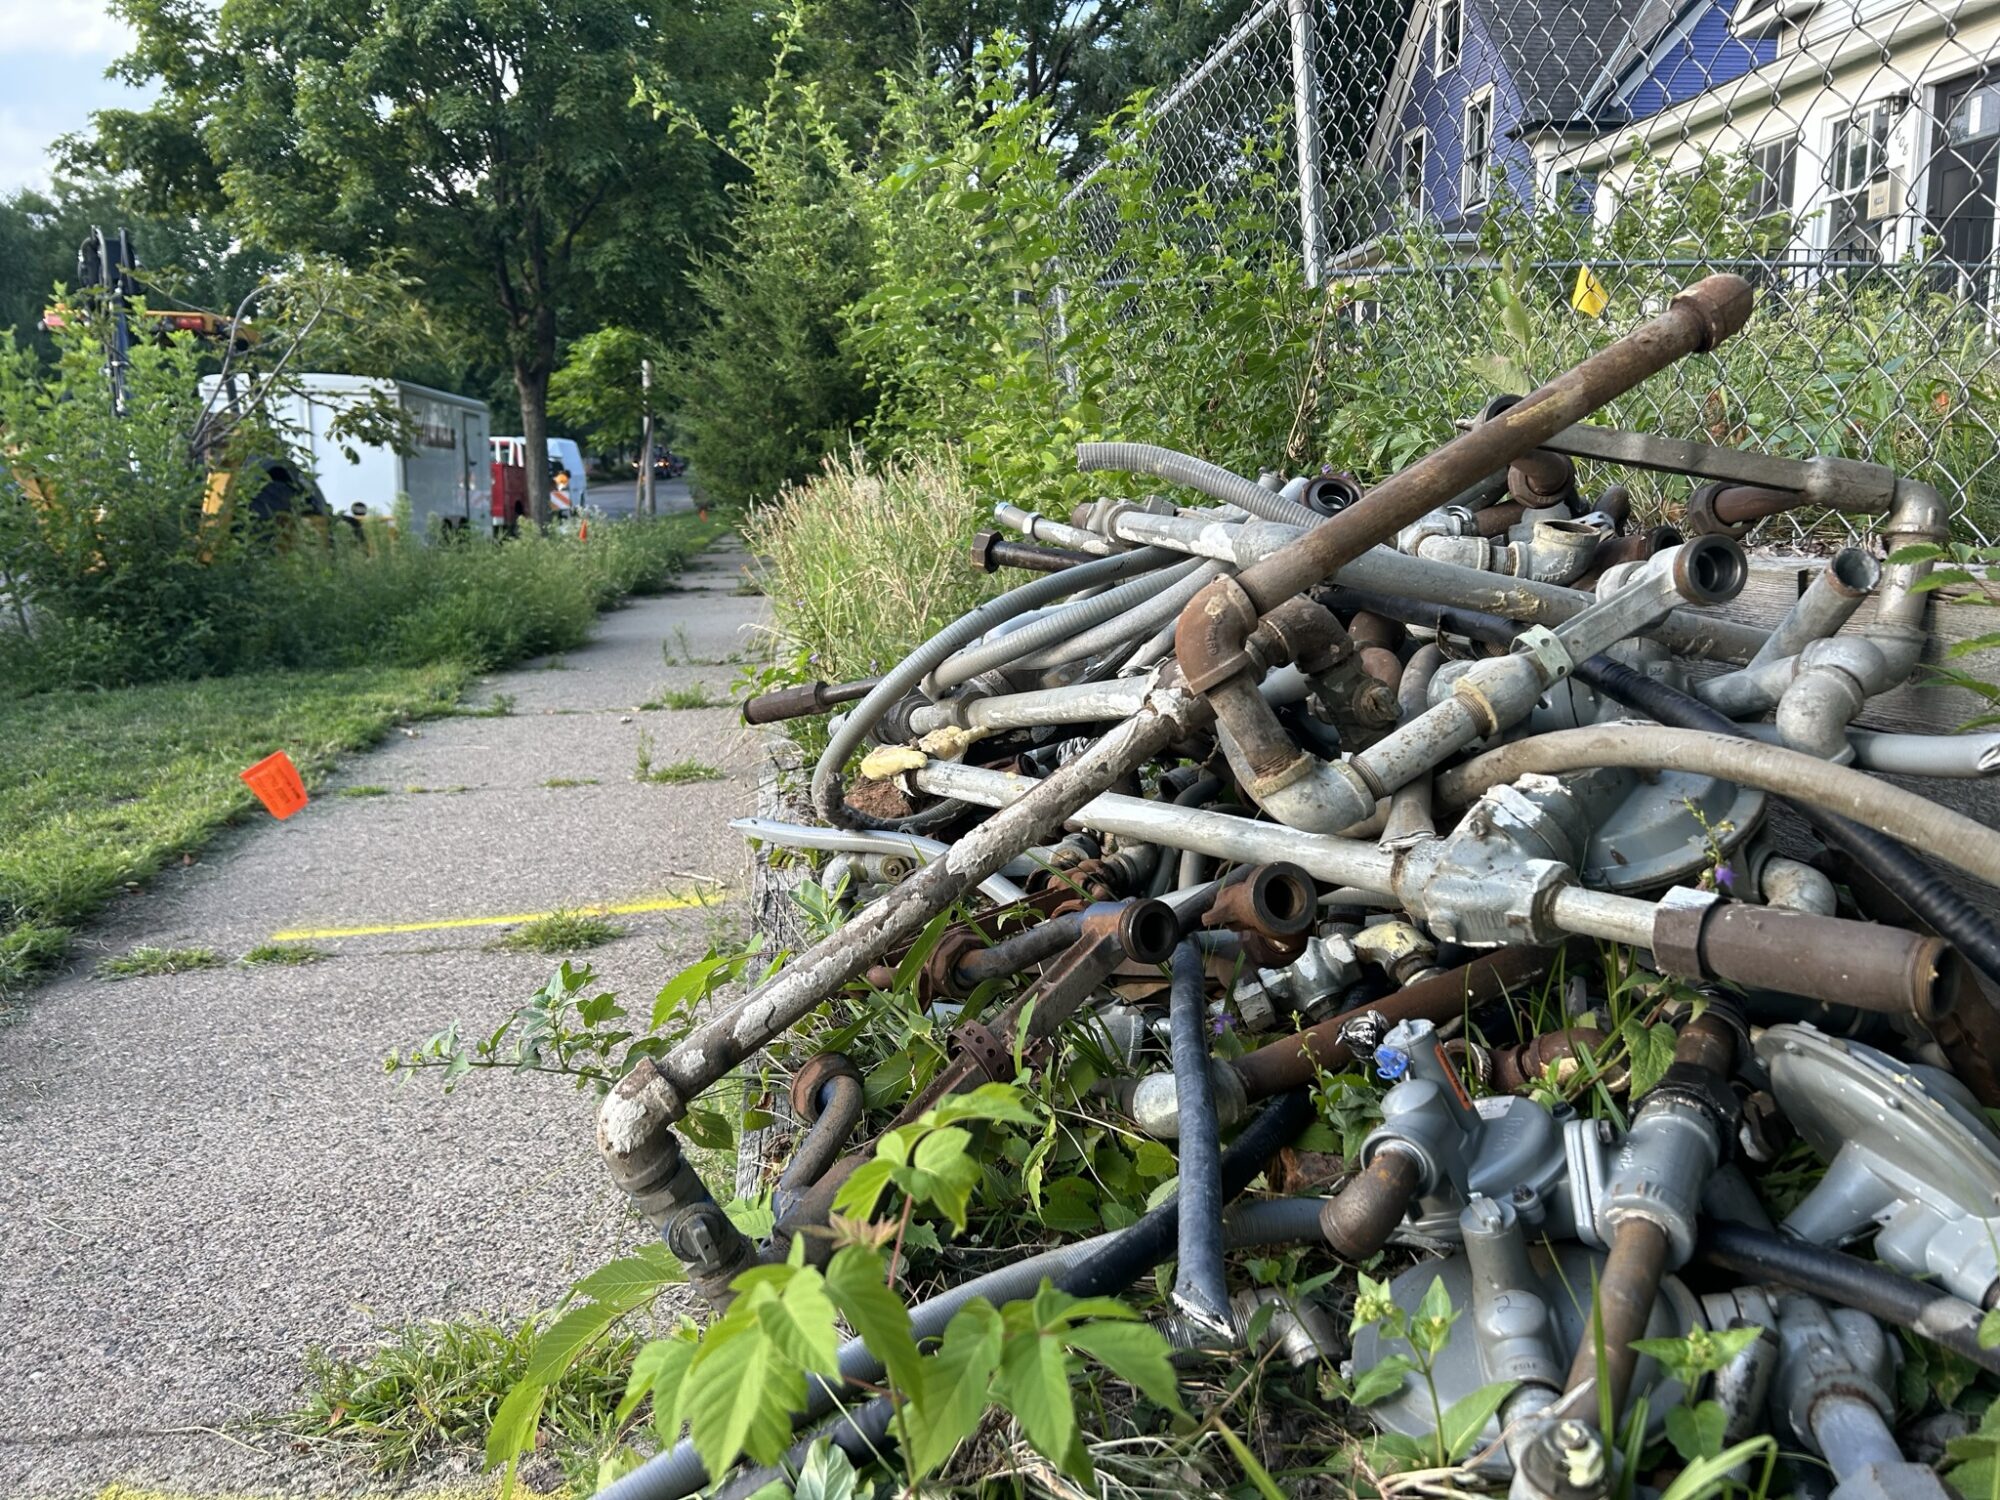
Service lines are the smaller pipes that connect to a gas main to deliver natural gas to a building, like a driveway connecting a home to a road. Service lines usually run beneath our yards and sidewalks, operating unseen beneath our feet before reaching the building’s gas meter.
Most natural gas distribution infrastructure in Minnesota is owned and operated by investor-owned utilities (IOUs), which are regulated by the Minnesota Public Utilities Commission (PUC). If you pay a monthly gas bill, it’s likely you deal with one of the five largest investor-owned gas utilities in Minnesota (in order of size): CenterPoint Energy, Xcel Energy, Minnesota Energy Resources Corporation (MERC), Great Plains Natural Gas Company (GPNG), and Greater Minnesota Gas (GMG).
Natural gas infrastructure is growing and expected to continue growing

Minnesota’s natural gas distribution system is incredibly large, and it is growing every year. The state currently has 34,483 miles of gas mains—enough to circumvent the earth nearly one and a half times! Ninety percent of these gas mains are owned by gas investor-owned utilities (IOUs) (with the rest owned by municipally-owned gas utilities that are generally smaller than IOUs). The total miles of all Minnesota gas mains have risen steadily year-over-year, mainly due to connecting more and more customers to the distribution system. The graph below shows the growth of natural gas mains in Minnesota owned and operated by the five largest gas utilities.
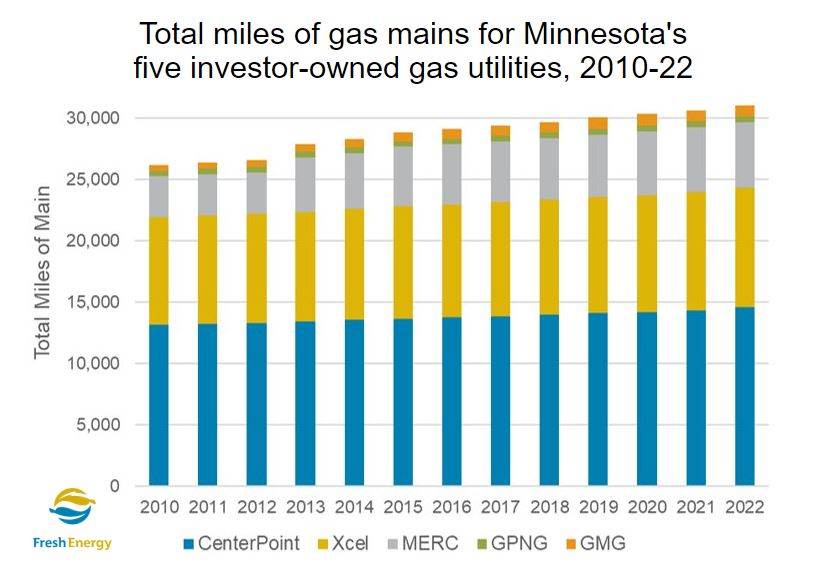
Every mile of gas main that is built represents a substantial investment in both cost (to install and maintain) and time, with many new gas pipes planned to be used and paid for as long as a half-century into the future. Since utilities recover their financial investments over time, every new mile of gas main also represents a potential commitment to burn gas for over a half-century while utilities recover their investment costs. In other words, a gas main installed in 2023 could still be in service in 2073, and we could still be paying for it.
Every mile of gas main that is built represents a substantial investment in both cost and time.
The volume of natural gas delivered to buildings is growing and expected to continue growing
The growing size of Minnesota’s natural gas infrastructure goes hand-in-hand with the growing consumption of natural gas in buildings.
The figure below shows natural gas sales data for residential and commercial customers (who primarily use gas in buildings) of the four largest investor-owned gas utilities in Minnesota from 2010 to 2022, with utilities’ projections up to 2038.
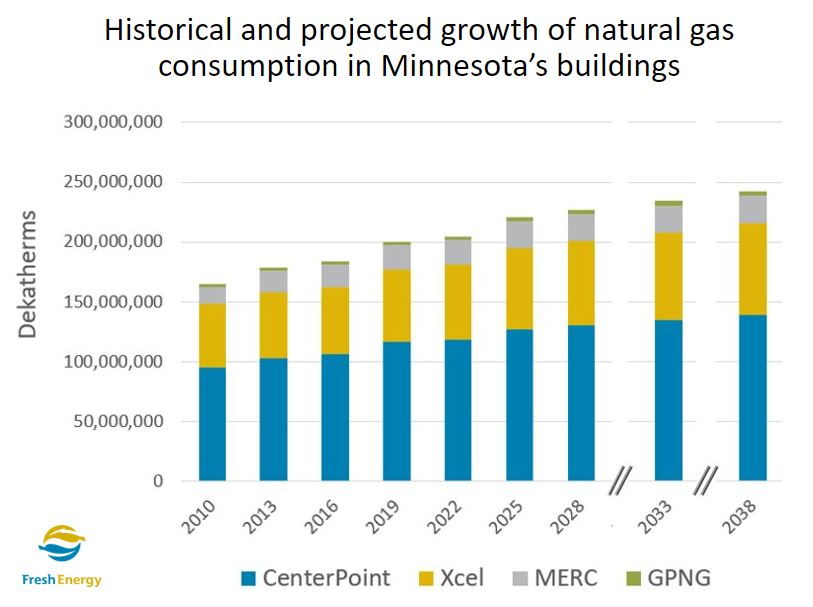
The figure above tells us that we’ve seen growth in natural gas use since 2010, and that gas utilities expect to continue growing in the future. While Minnesota has made great progress in making our buildings more energy efficient—which meaningfully reduces carbon emissions and lowers energy bills for customers—those gains are being offset by other factors, such as the increasing number of new customers that have connected or are projected to connect to the natural gas distribution system.
As the volume of gas delivered to our homes increases, so do the levels of criteria pollutants like carbon monoxide, particulate matter, and nitrogen dioxide from burning natural gas in our stoves, furnaces, and water heaters. These pollutants negatively affect human health and are linked to childhood asthma, certain leukemias and lymphomas, and respiratory and cardiac illnesses/disease. The incomplete combustion of natural gas has health and safety risks, including carbon monoxide poisoning, as well as home explosions and fires.
As natural gas deliveries increase, so will the greenhouse gas (GHG) emissions from burning the fuel. By 2030, emissions from burning gas in buildings could increase to 15% or more of Minnesota’s statewide carbon budget. Minnesota needs to reduce, not increase, the amount of natural gas used in buildings to meet state emission targets.
The graph below shows historical and projected growth in natural gas emissions in residential and commercial buildings compared to the reductions that are necessary to meet Minnesota’s climate targets. The red line, which shows natural gas utilities’ projections for continued growth through 2038, should instead be following the blue line, which shows Minnesota’s economy-wide emission reduction goals of 30% by 2025, 50% by 2035, and net zero by 2050. For Minnesota to reach its decarbonization targets, we need to slow and, ultimately, decrease emissions related to the natural gas distribution system.
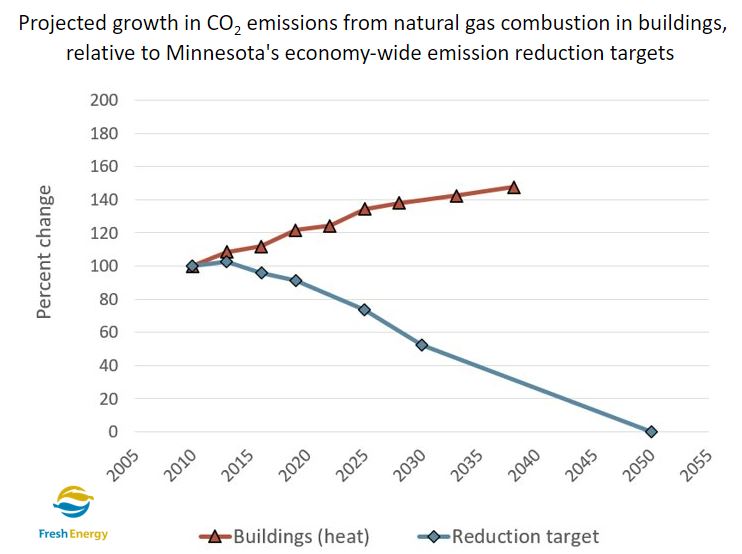
We’ve shown above that utilities expect their distribution system and the volume of gas flowing to customers within that system to continue growing well into the future. This is a challenge to our state’s emission targets to decarbonize the buildings sector, since burning natural gas is the sector’s biggest source of carbon pollution.
But we face an additional challenge: the gas system is getting older, and utilities have sped up the process of replacing old sections of pipe—which makes things even more complicated.
Gas infrastructure is being rapidly replaced, increasing costs and the risk of stranded assets
Minnesota’s gas system is both expanding and being rapidly replaced, as gas utilities have accelerated the replacement of their existing system over the past decade. Work performed over this time period has resulted in much of the oldest, leakiest, and riskiest pipe material like cast iron being replaced. Going forward, gas utilities continue planning to spend on these accelerated replacement projects, moving on to other older, legacy pipe materials such as steel and plastic pipe.
For example, CenterPoint testified in its 2023 rate case that its capital expenditures are expected to grow to at least $330 million annually for at least the next several years, and in 2022 CenterPoint’s capital expenditures were $415 million with distribution expenditures making up almost 90% of that total. This will have significant rate impacts for gas utility customers, especially as some customers increasingly turn to electricity to serve their heating and cooking needs.
As shown in the figure below, CenterPoint is planning to invest over a billion customer dollars to replace existing pipe over the next three decades.
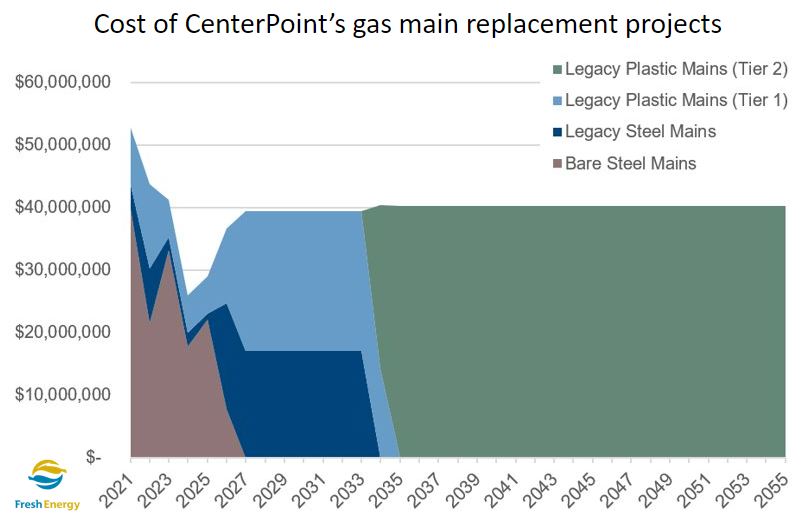
The challenge with replacing our gas infrastructure is three-fold. First, replacing pipe generally increases costs (also called rate base) but does not add utility customers. Ideally, a utility’s business model shares costs in a balanced way, where investments lead to an increase in the number of customers to share those costs. But when costs rise faster than customers or usage grows, utilities must increase rates, which strains their budget. Rate increases are particularly difficult for under-resourced customers, who spend a greater proportion of their budget on energy bills.
The second challenge is that new utility pipe has an expected useful life (utility lingo alert!) of decades, which runs right into (and beyond) the very time we need to be getting closer to net zero GHG emissions as a state. This means we will be paying for replacement projects well into the latter part of this century, even as we envision a much different future.
The third challenge is that utilities have a fundamental obligation to provide safe and reliable gas service, and an important part of that obligation necessitates continued investment in the system for the foreseeable future. Although these investments are driving increasing rates and increasing use of natural gas runs counter to Minnesota’s GHG reduction goals, utilities must be able to fulfill their core objective of safety and reliability. Future installments of this series will introduce some ideas about how to best balance these competing challenges to ultimately decarbonize the heating sector.
Through these challenges comes an opportunity, however, to reimagine how we heat. Stay tuned for more!
What’s next
By now, you hopefully understand more about Minnesota’s hidden natural gas distribution system that exists beneath our feet, as well as the challenges we face in decarbonizing the system while natural gas utilities are planning to expand it.
Over the coming months, we’ll be sharing several blog posts that unpack the complex challenges we face in decarbonizing Minnesota’s growing natural gas distribution system. Then, we’ll share some better news: the policy solutions we can implement to overcome these challenges, as well as the future role of natural gas in Minnesota. Stay tuned for more!
In the meantime, register to join our webinar, Understanding the gas system, on December 14 from 11:30 a.m. to 12:30 p.m. Central to learn from Joe Dammel, managing director, buildings, to get the important information you need to truly understand the state of Minnesota’s gas system. You don’t want to miss this!
Sources:
1. Total miles of main for years 2010 through 2022 from PHMSA annual gas distribution data available at https://www.phmsa.dot.gov/data-and-statistics/pipeline/gas-distribution-gas-gathering-gas-transmission-hazardous-liquids
2. MN Public Utility Commission dockets 2011-04, 2014-04, 2017-04, 2020-04, and 2023-04. Data were taken from ‘Sales and Degree Days Data, Data Actual’ located in sheet 38 of the Excel Gas Jurisdictional Annual Report.
3. 2023 annual Gas Utility Data Reports (Docket #23-19). Sales volumes sales reported in the ‘SalesByCategory_Large’ sheet were converted to dekatherms for comparison to historical data.
4 .Data on the bare steel, legacy steel, and legacy plastic main replacement projects was taken from testimony and workpapers for CenterPoint’s infrastructure and integrity management program in its most recent rate case (JMW-D pg. 27-32 and Exhibits JMW-WP Schedule 2, Workpapers 4-6 in CenterPoint Rate Case, Docket #23-173, November 1, 2023).
