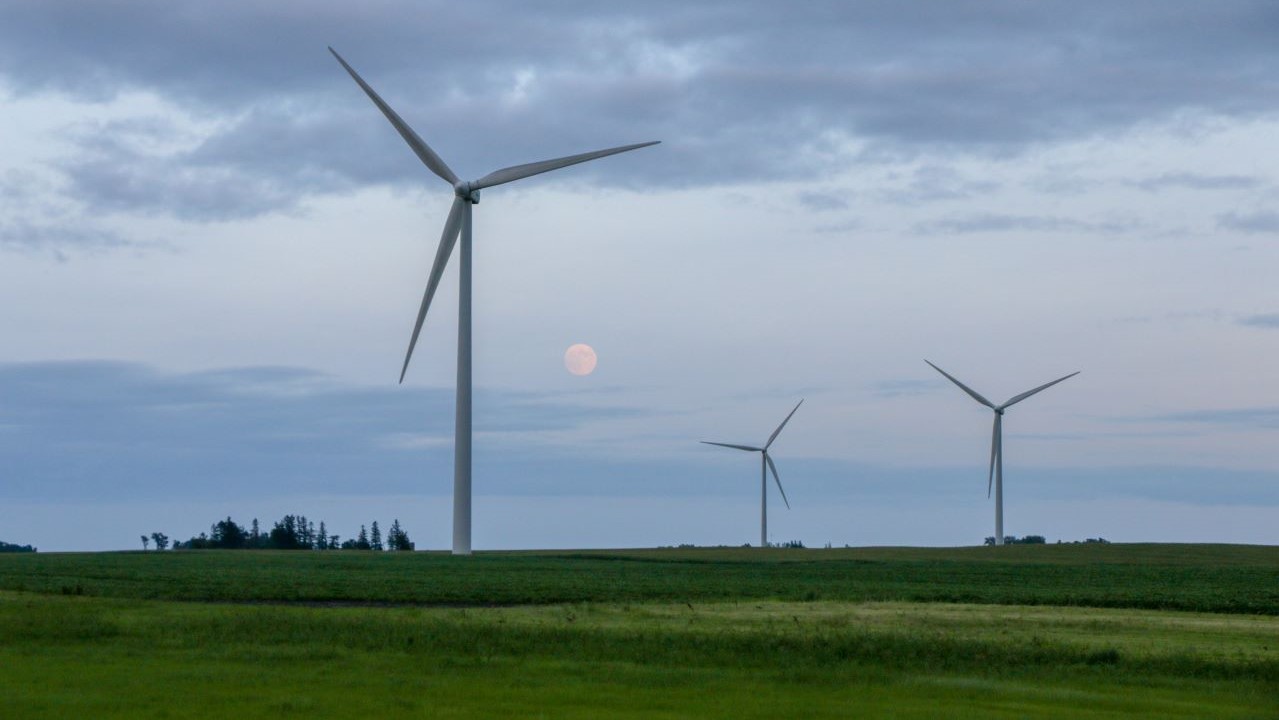
Although we often tend to think of coastal and desert areas being the places where extreme weather hits hardest, Minnesota is no stranger to these dangerous extremes either. We know there is a link between extreme weather and climate change—with carbon emissions and pollution contributing to drought, flooding, fires, and more here in the North Star State and beyond. The good news is that renewable energy is key to preventing the worst of climate change and is a critical part of powering our economy throughout the year. What’s more, the grid work and transmission buildout that is necessary to maximize carbon-free electricity and maintain the reliability we need is underway across our grid operator MISO’s territory right now.
Minnesota and much of the Upper Midwest experienced heat waves in June, including multiple days with temps in the upper 90s—even surpassing 100 degrees in the Twin Cities! Dive into this data snapshot for the details on how renewable energy helped keep the lights on and air conditioning running on those days.
Renewables and reliability
Renewable power options like wind and solar have significant environmental benefits with real value for our economy, our communities, and peoples’ lives. But clean energy has also proven to be an increasingly reliable source of energy for our usage demands—even on many of the hottest days of the summer.
While it’s true that the sun doesn’t always shine and the wind doesn’t always blow, it would be an oversimplication to claim that we can’t depend upon wind and solar as two main sources of clean power. All the robust energy modeling we have tells us the same thing: Wind and solar must form the backbone of our electricity system going forward. Consider just how advanced our technologies and software are today, and it’s clear that we have the tools, technology, and planning systems readily available to help us ensure that our electricity is reliable.
We also know that, to achieve a reliable carbon-free electric supply, we’ll need to scale up other types of carbon-free electricity to help us fill any gaps in the renewable power supply. In addition to hydropower and existing large nuclear power, there are many “fill-in-the-gap” options on the table, such as batteries, advanced transmission solutions, long-duration energy storage, and many promising emerging technologies (we’ll save those for a future blog post!). But for now, it’s exciting to take a look at the contributions we’re already seeing from the renewables that have been built out mostly over the past decade.
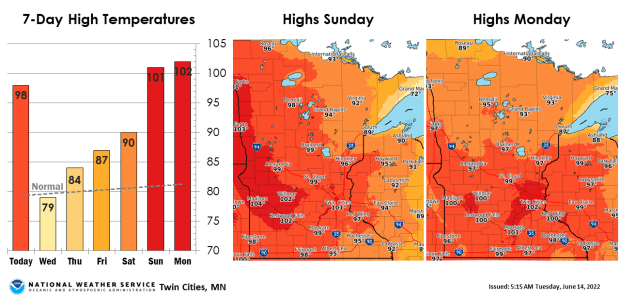
In this blog, we take a look back at the hottest days in June 2022 and the electricity sources that powered our air conditioners and kept our lights on. Here’s a quick overview of our process: First, we compiled the maximum daily temperatures in June for three states: Minnesota, North Dakota, and Iowa. We chose these states specifically as they make up the MISO North Region, which is the geographic focus of our analysis. For the specific days in our analysis, we selected the hottest days in each state to reflect the hottest temperatures across the entire MISO North region (referred to as MISO North from here). For each selected day in our analysis, maximum temperatures were often in the 90s or higher across all three states. Then, we looked at what sources were providing electricity during those days in MISO North. These energy sources include coal, gas, nuclear, hydropower, wind, solar, and a small amount of other generation sources.
Chart 1: Overall generation by fuel type during June’s hottest days
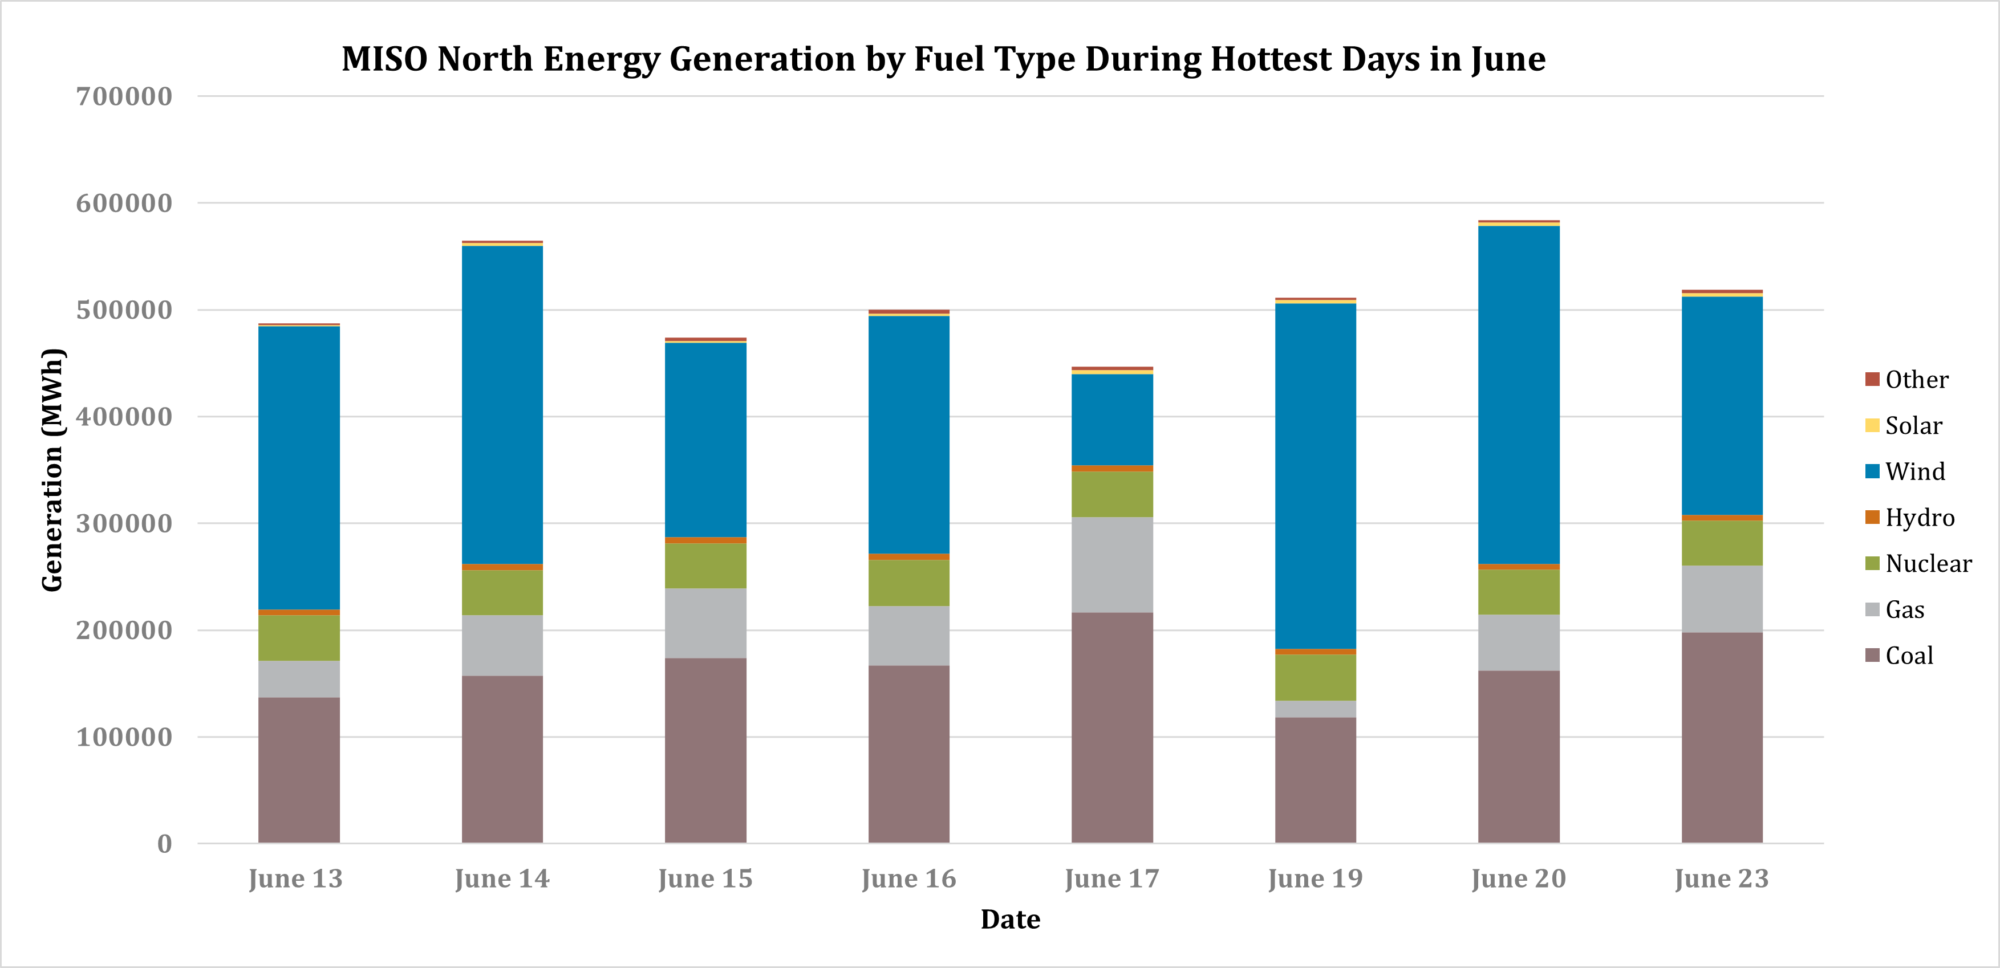
This chart shows the contribution from different electricity sources in MISO North on the hottest days in June. As you can see, wind power provided the most electricity over these days, pushing five of these days over 50 percent carbon-free electricity and getting to as high as 64 percent on June 19 and 55 percent on June 20.
Next, we took a closer look at June 19 and 20, which were the two hottest days in June in our region, with temps reaching a high of 97 and 101 respectively in the Twin Cities.
Chart 2: June 19 and 20 renewable energy generated by fuel type, hourly data
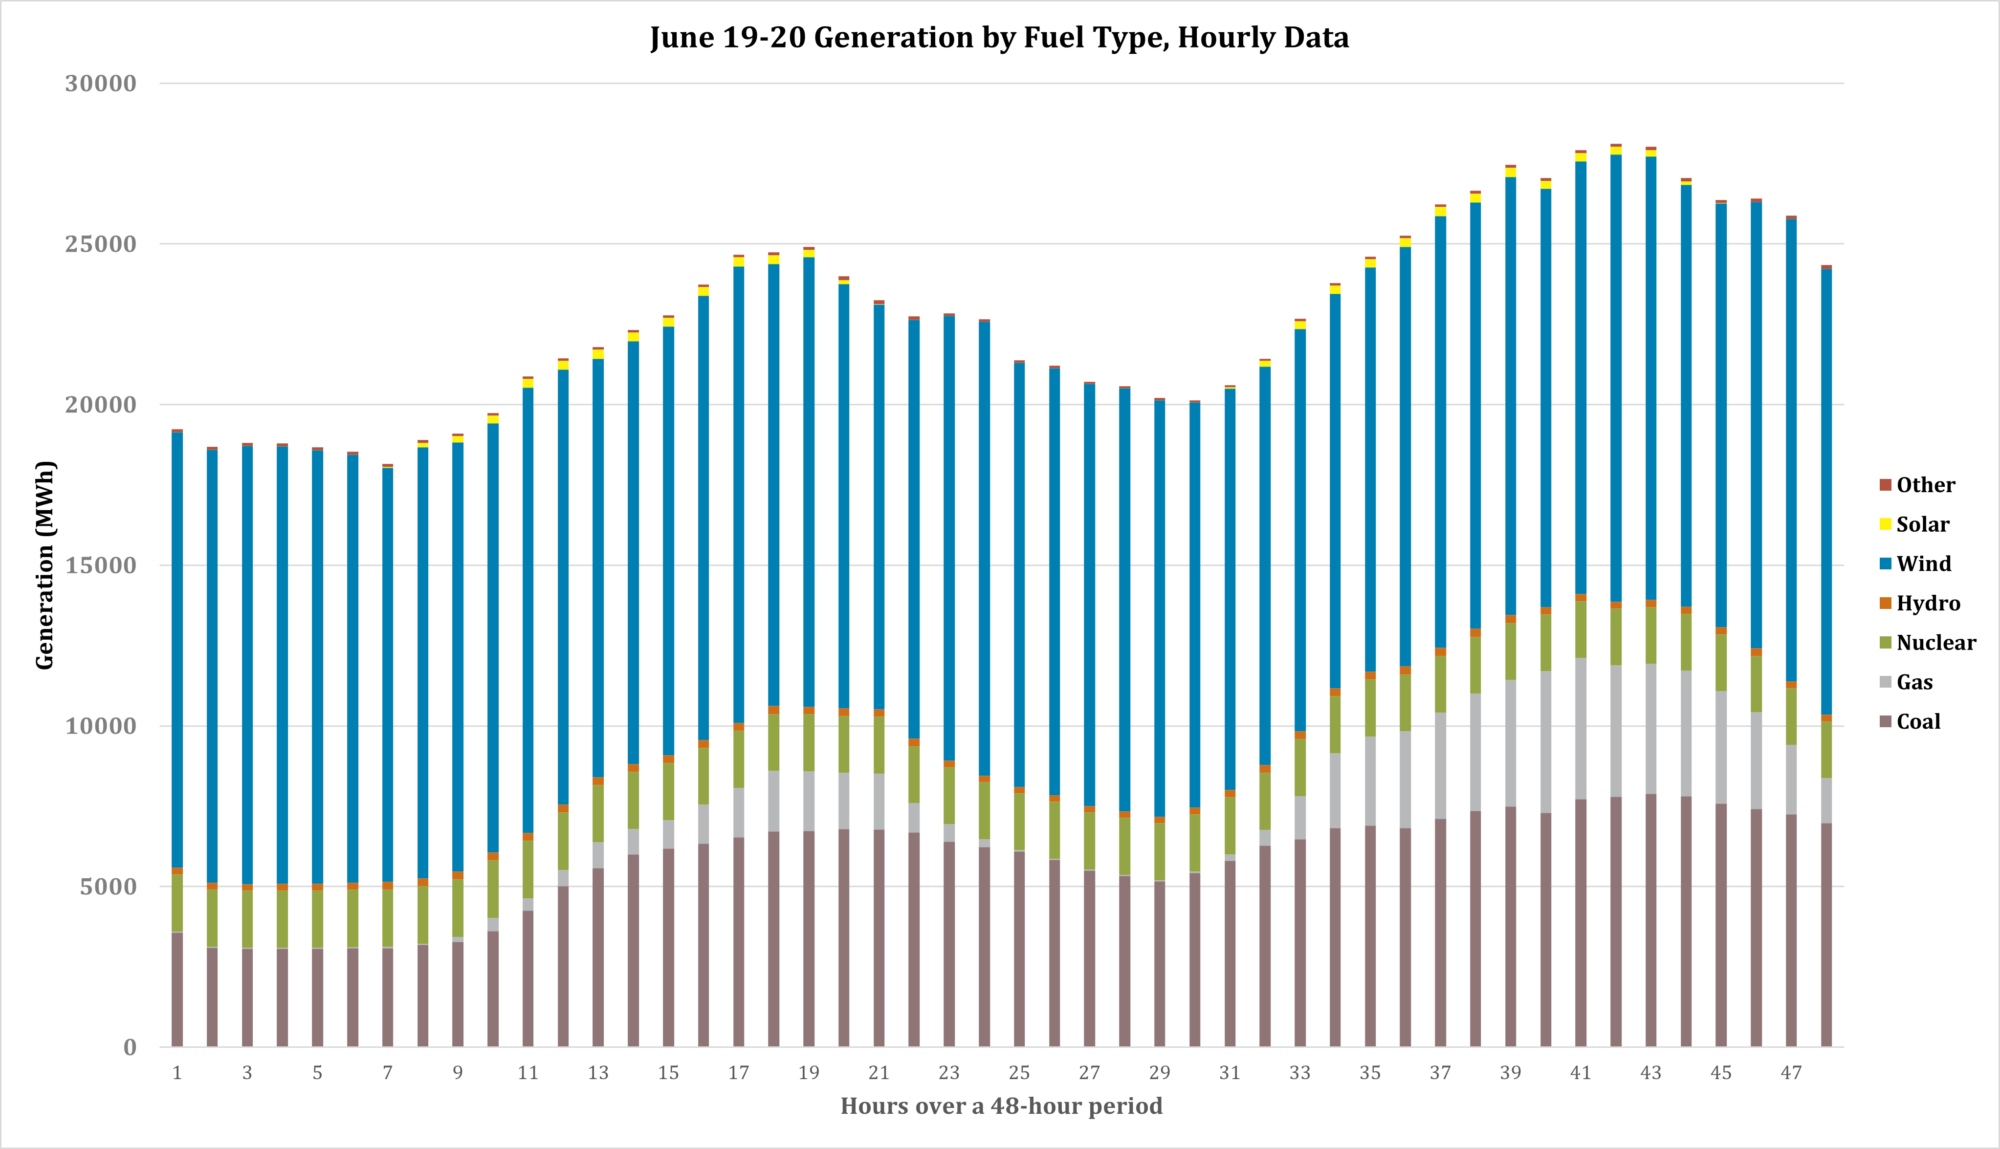
This chart shows what sources of electricity were meeting demand at each hour over this 48-hour period. We see that wind wasn’t just contributing overnight, but that it was very consistent over the entire two-day period and was the majority resource even during the peak hours of these very hot days.
While wind was the stand-out performer on June’s hot days, heat almost always means lots of sunshine. Not surprisingly then, solar was also providing electricity at a very high level on these hot June days, even though it’s just a blip on our first two charts. That’s the case for the simple reason that the upper Midwest has been building out wind power for almost 20 years, while solar is a relatively recent addition to the Upper Midwest. With tens of thousands of megawatts of solar waiting to connect to MISO, we know plenty of solar is on the horizon, but for now, there’s over 10 times the amount of wind than solar in MISO. Nonetheless, we can look at solar’s performance over these same days to get a sense of how a bigger solar fleet would have performed and how it would have significantly reduced the need for coal and gas on these June days.
To see what that might look like, Chart 3 shows what solar would have contributed during June’s heat if we scaled-up the existing MISO North solar fleet to roughly the same scale as the current wind fleet, which is a reasonable expectation for solar build out in our region over the next decade.
Chart 3: Actual generation compared to hypothetical future solar fleet in MISO North
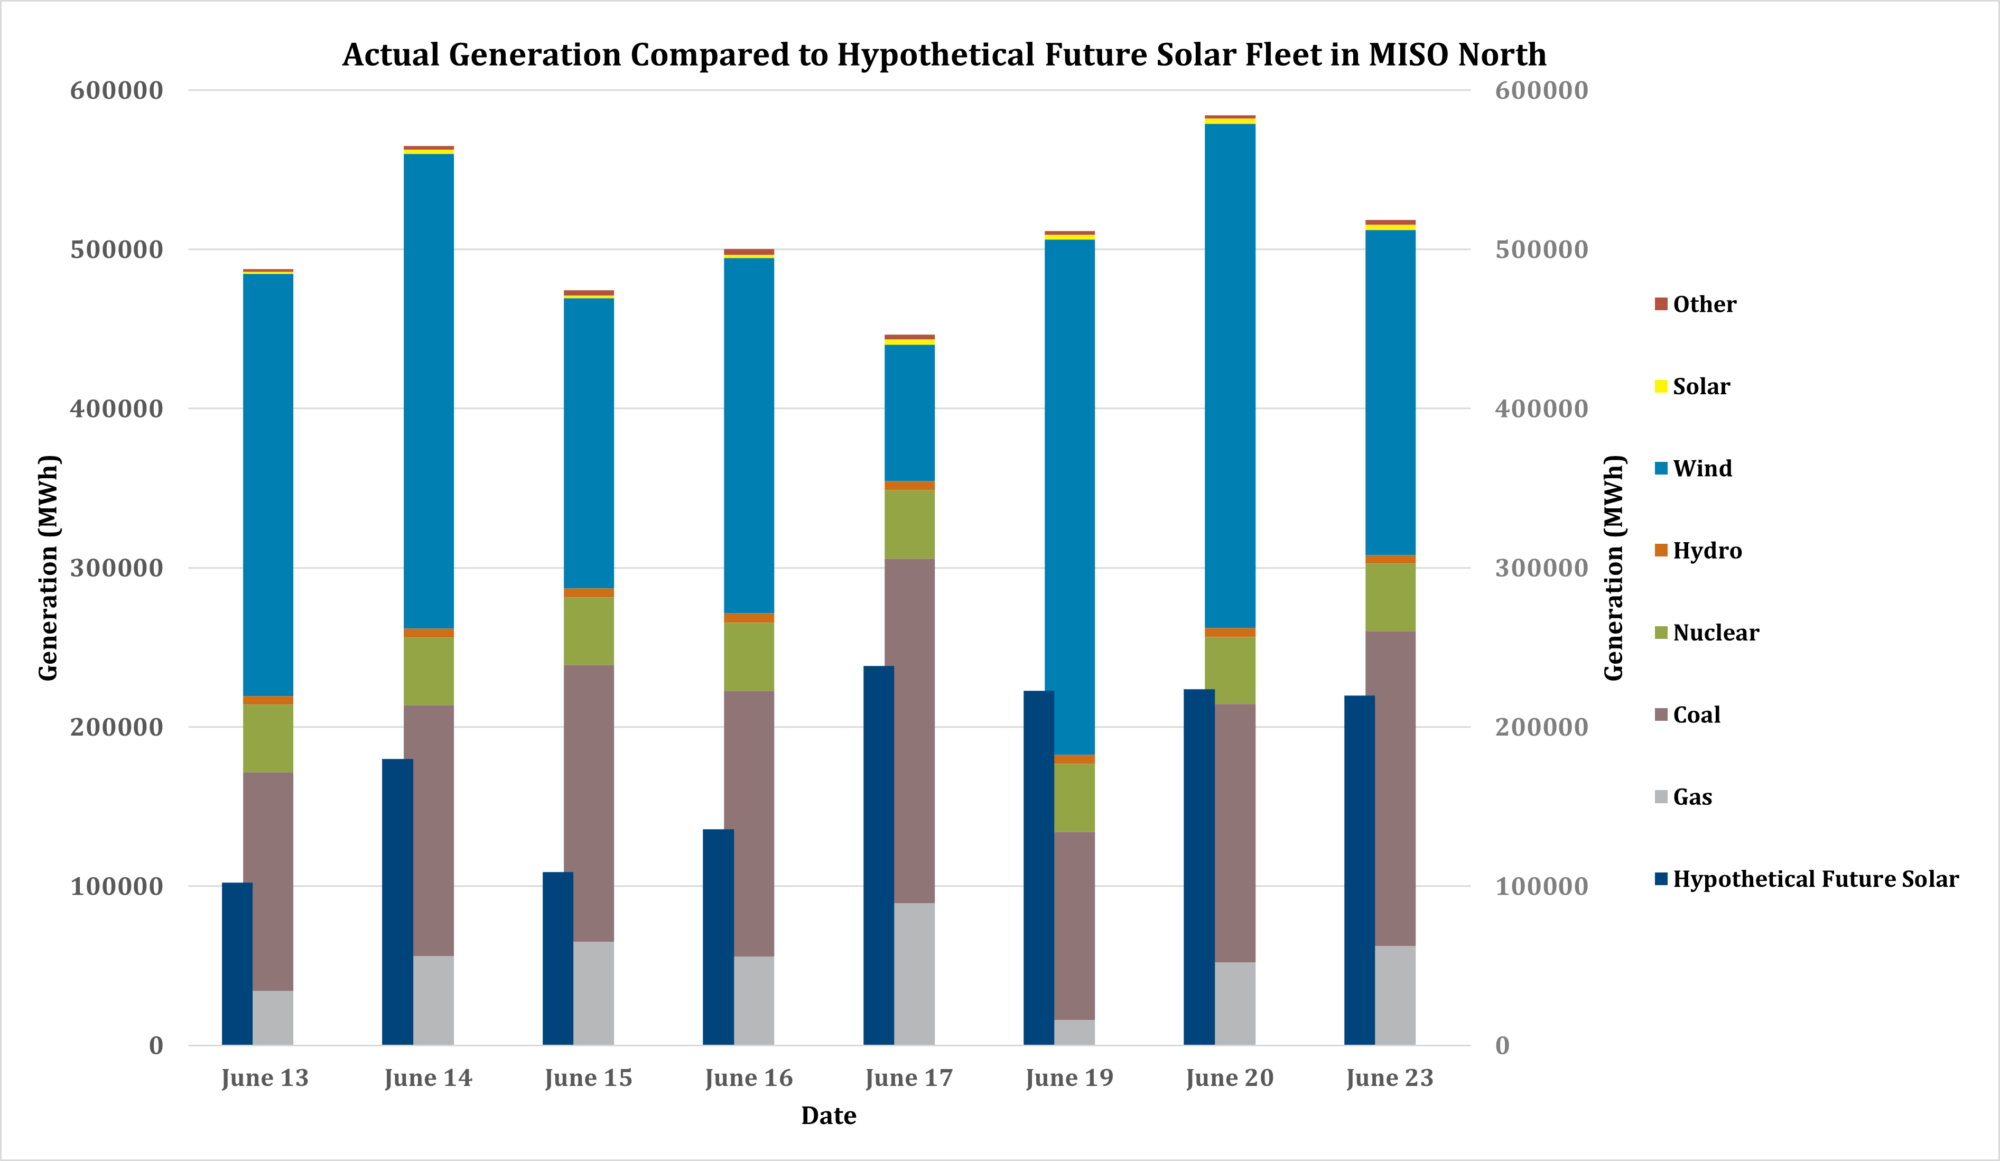
We can see in Chart 3 that, as expected, solar provides significant energy on hot days, and with our hypothetical future solar fleet, on the hot June days it would have generated enough electricity to displace an enormous amount of fossil fuel generation.
By digging into these days in June, we can see that wind and solar are critical energy sources to utilize, even as we face ongoing extreme weather fueled by climate change and work toward a carbon-free electricity system. Fresh Energy’s Clean Electricity team keeps this front and center in their work speeding the transition to a zero-carbon electric grid ready to reliably power a carbon-free economy.