Minnesota-based conservative think tank Center of the American Experiment (CAE) recently published a report on the impacts of the landmark 2007 Next Generation Energy Act. Passed in 2007 with near universal legislative support and signed into law by Republican Governor Tim Pawlenty, the Act aimed to spur renewable energy generation and save utility customers money through energy efficiency and conservation—all with the goal of reducing economy-wide greenhouse gas emissions in Minnesota 80 percent by 2050.
Yet, in spite of this bipartisan support, CAE’s report attempts a scathing censure of the Act, arguing it has cost Minnesotans money and failed to reduce emissions. With analysis founded on misunderstandings and outright falsehoods, the CAE report is deeply flawed and largely incorrect. In reality, the Next Generation Energy Act has been a roaring success—cleaning our air, saving us money, and boosting our economy. Below is a detailed explanation of how CAE’s report got it wrong. For a more concise rundown of the benefits of the Next Generation Energy Act, see our recent article in MinnPost.
Minnesota’s electricity bills are among the lowest in the Midwest
One of the CAE’s main contentions is that electricity is becoming expensive in Minnesota, causing us to lose our competitive advantage. CAE goes on a lengthy diatribe, citing rising rates and concluding Minnesota consumers would have saved $1 billion in 2016 absent the state’s ambitious carbon dioxide reduction policies.
However, CAE’s conclusions are the result of a misunderstanding of the U.S. Energy Information Administration’s (EIA) use of the term “rates.” In reality, Minnesota’s electricity bills are among the lowest in the Midwest (and well below the national average), and our advantage over our neighbors has actually increased since the passage of the Renewable Energy Standard.
How could CAE have gotten it so wrong? By misunderstanding the EIA’s “average electricity rates” statistics. As its name suggests, the Energy Information Administration keeps a lot of data on energy consumption and production. One statistic that the EIA regularly updates is the average electric rates for each state and utility. However, the use of the word “rates” is a bit misleading. The data collected by EIA is not the actual rates that customers would find on their electric bill. Rather, EIA calculates rates using a very simplistic formula: total revenue from electricity sales divided by total electricity sales (in kilowatt hours). In other words, it’s simply a comparison of utility revenue and sales, and while it gives a number in dollars per kilowatt hour, this “rate” does not correspond to what customers actually pay for electricity.
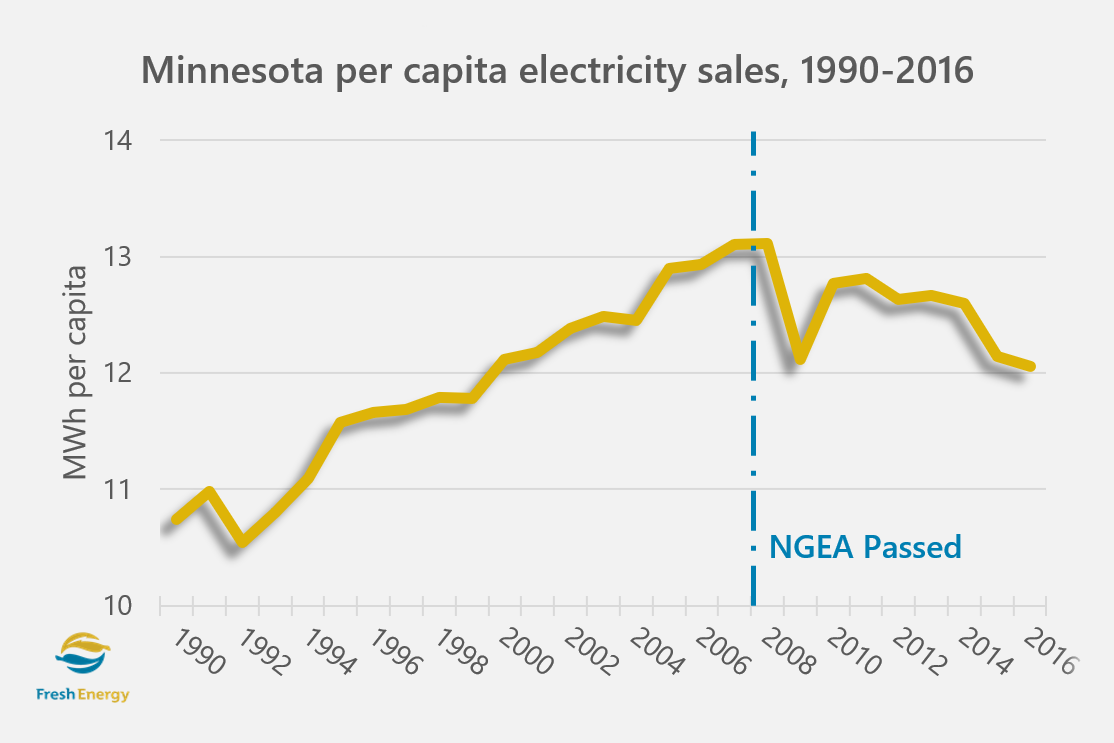
The problem with this approach is that it does not take in to account the tremendous work done by Minnesotan families and businesses to reduce electricity consumption. The Next Generation Energy Act not only included the Renewable Energy Standard, it also spurred energy efficiency and conservation. Energy efficiency helps customers use less energy, and save money, even as more appliances and electronics enter our homes and businesses. As shown in the chart above, per capita electricity sales in Minnesota increased 1.2 percent per year on average between 1990 and 2007. Since the Next Generation Energy Act, however, electricity sales have actually declined by 1 percent per year. This is great news for consumers and utilities—who have fewer power plants to pay for—and for the planet, as all of those emissions are avoided.
But, despite all the tremendous benefits of energy efficiency, the EIA rates calculation makes conservation appear to be a bad thing. Remember that the EIA rates calculation is simply total revenue divided by total sales. When consumers reduce electricity usage, many utility costs—like the fuel that would have been used in the power plant—are avoided, but some—like the administrative costs of running the company—are fixed and will still need to be recovered from customers. So, in the EIA’s rates calculation, the denominator is decreased more than the numerator, making the “rate” appear to increase. In reality, the customer savings far outweigh the increased “rate,” but focusing only on the EIA rates calculation, as CAE did, paints an incomplete and deceptive picture.
What should CAE have focused on instead? Electric bills, not rates. After all, bills are what families and businesses pay each month. No one has ever sat around the dinner table discussing how electricity rates impact the family budget; what matters for their budget is their total electric bill.
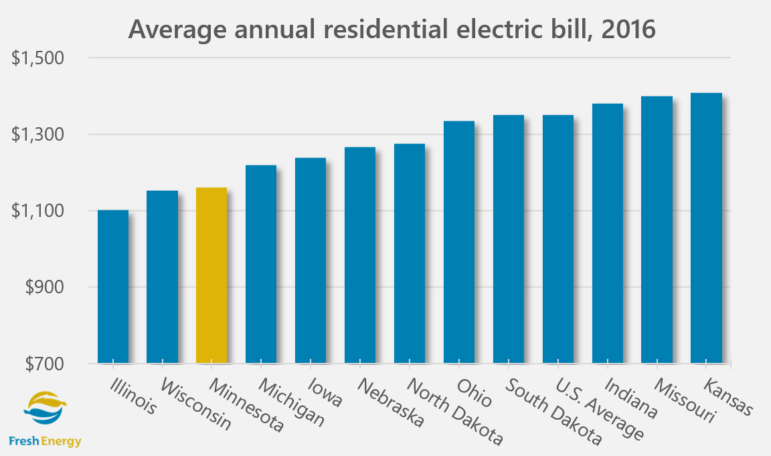
So, how does Minnesota stack up? Thanks to energy savings and low-cost renewable additions, Minnesota has some of the lowest residential electricity bills in the Midwest, as shown above. Minnesotan families spend $190 (or 15 percent) less per year on electricity than the national average.
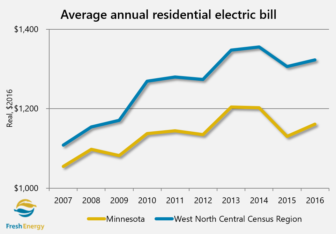 And, compared to our neighbors, Minnesota’s electric bills have only become more competitive since the Next Generation Energy Act was passed. The chart to the right shows how residential electricity bills have changed since 2007, comparing Minnesota to our neighbors in the West North Central Census region (Iowa, Kansas, Missouri, Nebraska, North Dakota, and South Dakota). As the chart shows, Minnesota had slightly lower bills than the region at the time of the Next Generation Energy Act, but since then, bills have grown considerably faster in neighboring states than in Minnesota. Over those 10 years, the average Minnesota family paid $1,200 less for electricity than families in neighboring states.
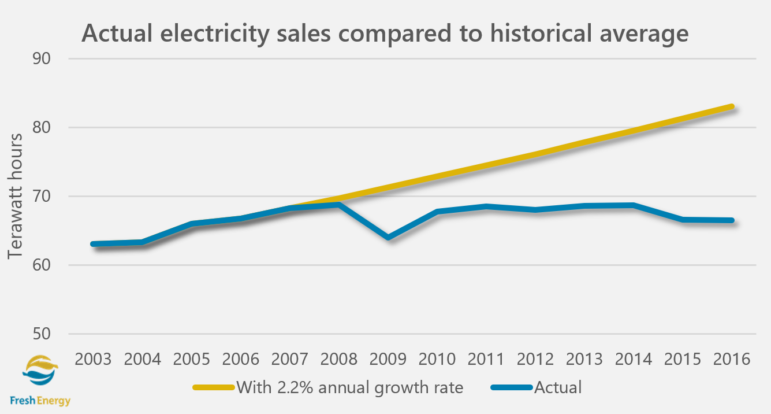
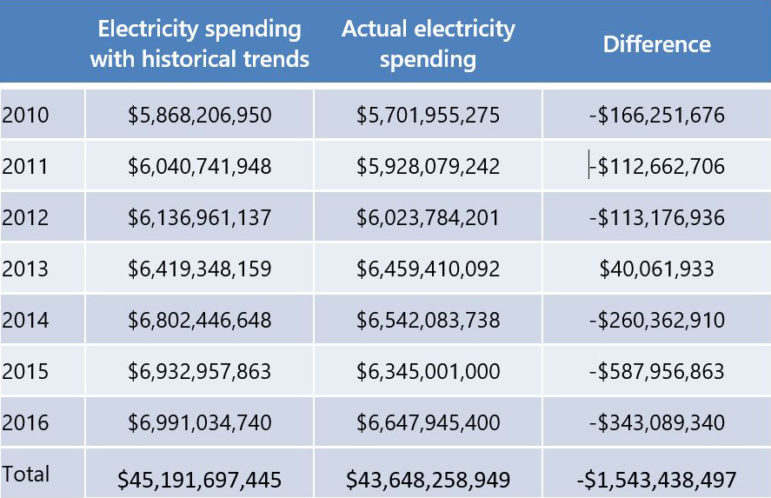
CAE also claims that losing “pricing advantage” has cost Minnesotans billions of dollars. Here, again, CAE’s analysis is founded on the same misunderstanding of EIA rates. But, it does raise an interesting question: how much more would utility customers have paid if sales and rates had continued along their historical trends? Minnesota’s electricity sales increased 2.2 percent per year on average between 1990 and 2007. The chart below compares actual electricity sales and how much more electricity Minnesotan families and businesses would have had to pay for, had this trend continued.
Those avoided electricity sales have really added up to significant savings. Even if Minnesota had maintained its historical “pricing advantage” as calculated by CAE, these additional purchases would have more than outweighed the impact of lower rates. As the table below displays, Minnesota families and businesses would have paid $1.5 billion more in electricity bills between 2010 and 2016 if historical trends had continued, as CAE so fervently pines for.
The Renewable Energy Standard has dramatically lowered greenhouse gas emissions
In addition to its rant on rates, the Center of the American Experiment also made the baffling claim that “As electricity generation from carbon free wind approaches 20 percent of total generation, Minnesota has not experienced any appreciable reduction in greenhouse gas emissions relative to the U.S. average” (page 1).
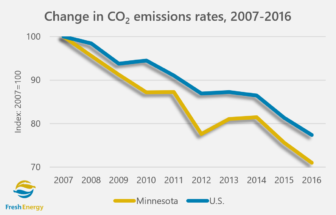 Of CAE’s many gripes, this may be the most easily refuted. As the chart to the right illustrates, Minnesota’s electricity generation has become significantly less carbon-intensive since the passage of the Next Generation Energy Act. Carbon dioxide emissions per kilowatt hour have fallen steadily in the U.S. since 2007, but in Minnesota, emissions rates have fallen even faster, dropping 29 percent from 2007 to 2016. This advantage will likely increase moving forward, thanks to bold leadership from utilities like Xcel Energy, which will get 33 percent of its electricity from wind power by 2021 and aims to get 60 percent of its electricity from renewables by 2030.
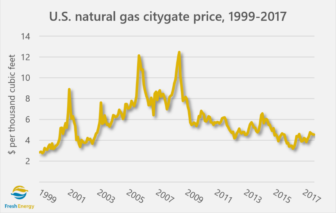
More importantly, the carbon dioxide emissions reductions in Minnesota will likely prove to be more durable than those of the U.S., because the national carbon dioxide reductions are due largely to an increase in electricity produced with natural gas. As CAE noted, “Between 2005 and 2015, natural gas generation grew from a 5.1 percent share to a 13 percent share of Minnesota’s electricity generation. By contrast, natural gas grew from an 18.8 percent share to a 32.7 percent share across the U.S.” (page 13). As CAE noted, this is primarily attributable to the recent decline in natural gas prices. As the price of natural gas falls (relative to coal), it becomes less expensive to run natural gas power plants, and so they are dispatched more often. This means in times of relatively low natural gas prices, natural gas power plants run much more often, usually replacing coal generation. But, this is a double-edged sword: when natural gas prices rise, natural gas plants will run less often, and coal plants will run more often. As shown to the left, natural gas prices have been extremely volatile.
Relying heavily on natural gas for electricity generation may offer some carbon dioxide emissions reductions, but it does so while exposing customers to sudden spikes in fuel costs, which utilities pass directly to customers through the fuel clause. By contrast, electricity generated by wind and solar has no fuel cost, and the per kilowatt hour costs for utilities are fixed over the term of the power purchase agreement, which means utilities and customers know exactly how much they will be paying for wind and solar power. This fuel price hedge is a tremendous benefit of renewable generation.
Wind power is the lowest cost electricity generation source in Minnesota
Which brings us to perhaps the most important point: in the Upper Midwest, wind power is, by far, the lowest-cost electricity generation source. The Great Plains have some of the best wind resources in the world, which translates into low-cost electricity. How low? Utilities in Middle America have been purchasing long-term contracts for new wind farms for less than 2¢ per kilowatt hour.
That’s lower than just the cost of running existing coal or natural gas plants. The typical coal plant costs between 2.5¢ to 3.5¢ per kilowatt hour to run, which is about the same as combined-cycle natural gas plants at today’s prices. And, even with today’s relatively low natural gas prices, natural gas peaking plants typically cost from 6.5¢ to 7.5¢ per kilowatt hour to run. This last point bears repeating: it’s cheaper to build a brand-new wind farm—with a guaranteed electricity price over the life of the contract—than it is to simply run a coal or natural gas plant that is already built, even at today’s low natural gas prices.
In Minnesota, the Next Generation Energy Act has helped directly tie the falling cost of wind to the rise in clean energy jobs. Companies like Mortenson, Blattner, and Anderson Trucking are national leaders in building, engineering, and transporting wind farms because they reacted to the market signal that statewide policy provided. Now, even when projects are built in other states, Minnesota companies—more often than not—benefit.
The Next Generation Energy Act has helped Minnesota’s economy
The Next Generation Energy Act has also been a boon to Minnesota’s economy more broadly. Investments in renewable generation create about three times more jobs per dollar than fossil fuels. The clean energy sector employs over 50,000 people in Minnesota, and solar installer and wind turbine technician are the two fastest-growing occupations in the country. Wind farms also pay over $10 million a year to Minnesota counties for roads and schools.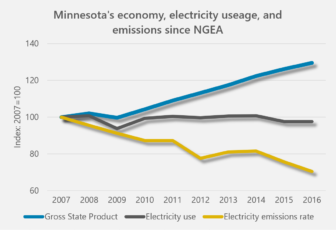
Between 2007 and 2016, Minnesota’s economy grew by 29 percent while greenhouse gas emissions from the electric sector fell by 29 percent—all while Minnesota enjoyed one of the lowest unemployment rates and one of the highest median household incomes in the country. In short, as our economy grew, energy conservation kept our electricity use flat and renewable energy ensured our emissions fell even as we produced more goods.
Given all of these benefits, it’s no surprise that public opinion polls show expanding renewable energy generation is extremely popular with Americans, Democrats and Republicans alike.
Electrify everything!
Finally, the Center of the American Experiment argues that the Next Generation Energy Act is “failing on its own terms, as it has not achieved a significant reduction in CO2 emissions” (page 2). Again, this claim is demonstrably false. As CAE itself admits, carbon dioxide emissions in Minnesota fell 6.6 percent between 2005 and 2014. This is a dramatic reversal of the historical trend, as greenhouse gas emissions rose steadily in the decades leading up to 2005. As detailed above, the electricity sector—which has traditionally been the largest greenhouse gas-producing sector of the economy—has seen the biggest declines; the electricity sector is already ahead of its 2015 greenhouse gas emissions target of 15 percent below 2005 levels, and it is on pace to meet the 2025 target of 30 percent below 2005 levels.
Yet, despite CAE’s misstatements, one of its underlying points—that Minnesota is not on track to meet its economy-wide greenhouse gas reduction goals—is true. The Minnesota Pollution Control Agency’s most recent report on progress towards the state’s greenhouse gas reduction goals only has data on emissions through 2014, but it’s clear that the state as a whole likely did not meet its 2015 greenhouse gas reduction goal, in spite of the significant progress made in the electricity sector.
CAE’s response is to throw up its hands and surrender, even arguing “a strategy focused on reducing emissions from electricity generation will never successfully meet the state’s greenhouse gas reduction goals” (page 6, emphasis added).
CAE’s reaction—cowering in the face of a challenge—is not only un-Minnesotan, it’s also incredibly short sighted. Perhaps the most frustrating part of CAE’s report is that it comes so tantalizingly close to recognizing the solution to our emissions problem. CAE collected the pieces, yet through a staggering lack of vision—or a willful blindness—failed to put the decarbonization puzzle together.
So, what’s the answer? Electrify everything! As CAE found, electricity generation is rapidly decarbonizing in Minnesota; it’s the only sector of the economy that’s on track to meet the state’s 2015 and 2025 goals, and it’s decarbonizing faster than the nation as a whole. CAE also found the second piece of the decarbonization puzzle, noting “it is possible future electricity demand in Minnesota could rise significantly if there occurs a substantial penetration of electric vehicles in surface transportation, and/or if there is a major transition to electrified energy use such as winter home heating” (pages 8-9).
Herein lies the two-part solution to meeting our ambitious greenhouse gas reduction targets: 1) rapidly decarbonize electricity generation; and 2) electrify as much of the economy as possible. As a state, we have made significant progress toward the first part over the last decade; the challenge for the next decade (and beyond) is to make comparable progress toward the second part.