Fresh Energy policy fellow, Lindsey Forsberg, prepared this report.
In the electricity market, like other markets, pricing is based on supply and demand. When demand (also known as load) is low and supply is up, electricity costs less in the wholesale market. But, electricity markets also are limited by the physics of moving electrons over wires at the speed of light, where electricity generation and consumption must be matched in real time. Given this dynamic, at times where there is more electricity generation available than load, the price for electricity on the wholesale market can go negative to reduce electricity generation so it meets load, through a market signal. This phenomenon is called “negative pricing.”
Because wind and solar power are nearly free to run when the wind is blowing and the sun is out, there is a concern that increased renewables may lead to more frequent negative pricing events. However, there has been little data.
Fresh Energy set out to find on how much, and how often, electricity pricing goes negative and what is causing the issue in Minnesota and our region. We took a dive into the numbers, analyzing wholesale market pricing data from 2015-2017 in the Midcontinent Independent System Operator (MISO) market, where energy is bought and sold from Manitoba to Louisiana.
What we found is that negative price events rarely occur and that their frequency has gone down over the past three years.
Key takeaways:
- Negative prices are occurring in the MISO market, but at very low frequencies—less than 2 percent of hours on average since 2015—and have declined over the past three years.
- MISO North, where a large percentage of MISO’s wind resources are located, have more negative price events but the frequency has also declined since 2015.
- In MISO North, load still has a greater impact on market hub prices than wind generation, although both are statistically significant.
What are negative prices and why do they occur?
Based on the supply of (generation) and demand for (load) electricity in a given market, the locational marginal price (LMP) is calculated in real time at thousands of market nodes. Minnesota participates in the MISO market where those nodes stretch from Fargo all the way to the Gulf of Mexico. The LMP value is a calculated combination of the electricity price, congestion on the transmission grid, and line losses. For coal and nuclear plants, it can be time consuming and expensive to ramp up or down, meaning they may choose to stay online all day regardless of the price of electricity. Wind and solar resources have a zero-dollar fuel cost, making them almost free to run whenever the sun is shining or the wind is blowing. Wind resources also benefit from federal production tax credits meaning they can often operate economically even while accepting negative prices. Therefore, it is possible for electricity supply to exceed consumer demand in wholesale electricity markets, and in these conditions, prices can go negative.
Negative prices are worth an extra look because they represent a strange phenomenon: generators paying, rather than getting paid, to provide electricity! In general, a high frequency of negative price events is a sign that the market isn’t operating efficiently, and electricity market design—including the transmission planning underpinning that design—should aim to keep negative pricing relatively infrequent.
What’s happening in the MISO market?
Fresh Energy looked at real time LMP data in the MISO market for the last three years to see if negative pricing is on the rise in our region. We looked at how frequently it is occurring and what times of day and months of the year it is more prevalent. The graph below shows the frequency of negative prices by hour ending in 2015, 2016 and 2017. For example, hour ending 1 includes all LMP prices recorded at every hour ending at 1:00 AM for every day in a given year. All commercial pricing nodes in MISO were included in the analysis.

As illustrated above, negative prices are occurring in the MISO market, but at low frequencies. In no hour did the average frequency surpass 5 percent, and over all hours and nodes the average frequency of negative pricing events was below 2 percent for all three years. In other words, the LMP price for each hour of 2015-2017 at each commercial pricing node was negative for less than 2 percent of those hours. In addition, it is worth noting that the frequency has decreased over the last three years despite 2,000 MW of new wind capacity coming online in the MISO footprint[1]. There is a small peak in negative price frequency in the early morning hours between 3:00 and 5:00 AM which matches expectations – in this timeframe wind generation is high and load is low.
What’s happening in and around Minnesota?
Minnesota falls within a region of MISO known as MISO North, which includes planning zones 1 and 3 pictured below. MISO North is home to approximately 34 percent of the wind generation capacity in the market scattered across North Dakota, Minnesota, and Iowa [2].

When we narrow our analysis to only MISO North, the trends are similar but the negative price frequencies more than double.

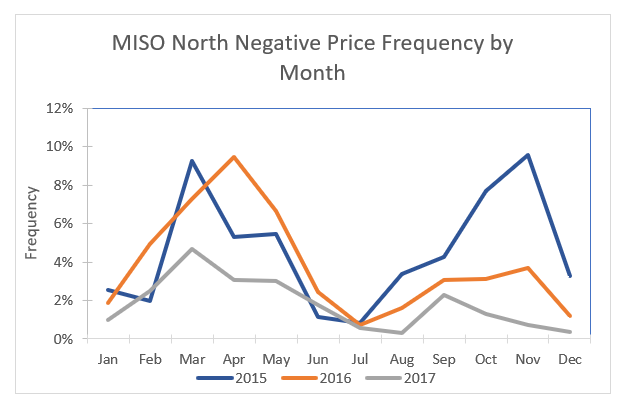
For MISO North, average frequencies for 2015-2017 range from approximately 2 to 5 percent, with hourly frequencies exceeding 10 percent in 2015 during the early morning hours. Here again we see a trend of decreasing negative price event frequency over the last three years. As expected in a high wind region (and as seen in the MISO-wide analysis), the highest frequencies occur in the 3:00-5:00 AM timeframe when wind generation is high and load is low. Negative prices are also more common in the fall and spring (below), again, likely because electricity demand is lower in these generally heating and cooling free seasons.

Fresh Energy also completed a statistical analysis of the relationship between 2017 wholesale electricity prices in Minnesota[3] wind generation in MISO North, and load in MISO North. Both wind generation and load levels had statistically significant effects on wholesale prices in Minnesota, but the impact of load on prices was approximately double the impact of wind generation. While fuel-free renewables (almost entirely wind in MISO North) are significantly lowering wholesale prices, load, i.e. electricity demand, is still a bigger player in determining price.
Lack of transmission capacity, which leads to bottlenecks for electricity delivery can, in theory, also contribute to negative prices. Limited transmission capacity can drive the congestion component of LMP negative. Think of a hose with water flowing through it – at a certain point you cannot add more water without fully filling the hose and needing to purchase a second hose or upgrade to a larger size. High congestion on the transmission system leading to negative congestion charges can therefore drive the whole LMP value negative if it is extreme enough. For MISO North, our statistical results showed that a $1 decrease in the congestion component of LMP only increased the probability of the final Minnesota Hub price being negative by 2 percent all else equal. This was a statistically significant result, but also suggests that transmission congestion is not the only factor driving prices negative in Minnesota.
What did we learn?
It is interesting that while some electricity markets like the California Independent System Operator (CAISO) are seeing large upticks in negative pricing events, frequencies in MISO are declining. Even in MISO North, where renewables are at a similar penetration levels to CAISO, negative pricing is on the decline[4]. One explanation might be that over a large geographic area wind has a more consistent profile across the entire day than solar, which could make it easier for the market to respond to despite being slightly more challenging to predict. As a whole, MISO is likely also benefiting from a much larger and more diverse footprint than CAISO. However, with wind and solar installations both on the rise in MISO and beyond, and is would be wise to get out ahead of the negative pricing issue to ensure it remains a “non-issue” for the MISO market.
There are three key interventions we can focus on to keep the market running smoothly:
- Continue (and expedite) transmission build out in MISO North and MISO as a whole to ensure wind resources can reach high load centers with ease. Congestion is not the only factor driving prices negative in MISO North but it is significant! As renewable deployment accelerates we should ensure transmission isn’t playing catch up.
- Retire inflexible fossil generating plants that cannot ramp up and down quickly to make it easier for supply and demand to match throughout the day.
- Increase the flexibility of the system by building out storage capacity, implementing new load management strategies, and updating market rules to properly value flexible capacity.
[1] 2018 MISO Wind Capacity Report
[2] 2018 MISO Wind Capacity Report
[3] Price information from the Minnesota Hub (link).
[4] Renewables integration in the Midwest is a whole other animal
